

Procurement visibility is the ability to see, in one reliable view, what your organization buys, from which suppliers, at what price, under which contract, and whether each purchase followed policy. It covers four layers of data (spend, suppliers, contracts, and process), and it comes before cost reduction because a team cannot classify, analyze, or act on spend it cannot see.
In most organizations, that single view does not exist yet. Spend is spread across ERP exports, corporate card statements, and approvals buried in email threads, and each source names suppliers and categories its own way. The same purchase gets counted three different ways, or never counted at all.
That matters because cost is the agenda. Improving margins through cost reduction and cost avoidance is the top enterprise priority in Deloitte’s 2025 Global CPO Survey, which covers more than 250 chief procurement officers in 40 countries. Every saving on that agenda follows the same chain: visibility makes spend analytics possible, the analysis points to an action, and the action produces a saving that finance can verify. The same idea often goes by the name spend visibility.
Key takeaways
- Procurement visibility is one connected view of what an organization buys, from whom, at what price, and under which contract.
- Visibility covers four data layers (spend, suppliers, contracts, and process), and savings appear only when those layers connect.
- Spend analytics turns visibility into savings in four steps: consolidate data, classify transactions, analyze spend, and act on findings.
- Procurement visibility is the buyer’s ability to see and act on its own data. Procurement transparency is information shared between parties.
- Organizations lose an average of 11% of contract value after signature, according to World Commerce & Contracting.
What is procurement visibility?
Procurement visibility is an organization’s ability to see its spend, suppliers, contracts, and purchasing process in one connected view, and to act on that data before money leaves the organization. It lets a buyer change where money goes next, while the price and the supplier can still move.
If your CFO asks how much the company spent with its largest packaging supplier last year, and the answer takes a week of spreadsheet work, your team has reports but no visibility. A team with procurement visibility answers questions like these in minutes:
- How much does the organization spend with one supplier across all business units and legal entities?
- What price does the contract set for this item, and what did the last invoice charge?
- What share of last quarter’s spend went through approved suppliers and purchasing channels?
- Which purchase requisitions and purchase orders are approved but not yet invoiced?
Month-end totals arrive too late to change anything, because by then the price, the supplier, and the quantity are fixed. Visibility earlier, at the purchase requisition and purchase order stage, shows committed spend (money promised through approved requisitions and POs but not yet invoiced), and a buyer can still move such an order to a contracted supplier or question its price before the cost lands in the budget. Committed spend also lets finance see how much of each budget is already promised for the coming weeks, which a closed month cannot show.
Supply chain visibility is a separate discipline: it tracks goods in transit, such as shipments, inventory levels, and delivery dates. Procurement visibility deals with spend and the records behind it.
What is the difference between procurement visibility and transparency?
Procurement visibility is the buyer’s own ability to see and act on its purchasing data, while procurement transparency is the openness of information shared between parties such as suppliers, internal stakeholders, and auditors.
Visibility belongs to the buying organization. It answers the questions procurement and finance ask themselves: what the organization spent, with whom, at which price, and against which contract. A team can have strong visibility and share little of it outside the company.
Transparency concerns what each party discloses to the other. A supplier that shares its cost breakdown, its delivery performance, or its subcontractors is transparent with the buyer. A procurement team that publishes award criteria to bidders, or gives auditors a traceable path from requisition to payment, is transparent toward them.
Side by side, the two terms differ in where the information goes and who uses it:
| Term | What it means | Who it serves |
| Procurement visibility | The buying organization’s ability to see and act on its own purchasing data | Procurement and finance, inside the organization |
| Procurement transparency | Information shared openly between parties, such as cost breakdowns, award criteria, or audit trails | Suppliers, bidders, internal teams, and auditors |
The two depend on each other. Supplier transparency feeds the buyer’s visibility, since price and performance data then arrive in a form the buyer can use, and visibility lets procurement be open with finance about where every savings figure comes from.
Spend visibility: what each layer of procurement data shows
Spend visibility breaks down when procurement data lives in several systems that do not agree with each other. The ERP records purchase orders, accounts payable records invoices, card programs record small purchases, and many approvals happen in email. Each source spells supplier names its own way and uses its own categories, so one packaging supplier can appear as three suppliers with three smaller totals.
Each layer of procurement data answers a different cost question, and a missing layer hides a specific kind of loss:
| Data layer | What it contains | What it lets the team see | The cost question it answers |
| Spend | Invoices, purchase orders, card transactions, and expense claims, each with an amount, a date, and a cost center | Spend by supplier, category, and business unit at the same time (the spend cube) | Where does the money go, and where is it split across too many suppliers? |
| Supplier | Supplier master data: legal names, tax IDs, locations, risk and performance scores | One record per supplier, with delivery and quality performance next to spend | Which suppliers deserve more volume, and which cost more than their price suggests? |
| Contract | Agreed prices, discounts, payment terms, volume tiers, and expiry dates | Which purchases a contract covers, and at what agreed price | Are we paying the price we negotiated? |
| Process | Requisitions, approval steps, and purchase orders with their status | Committed spend and the route each purchase took through the approval workflow | Did this purchase follow policy before the money was committed? |
The spend layer shows where money goes, the supplier layer shows who earns it, the contract layer shows what it should cost, and the process layer shows whether the rules were followed before it was committed. The layers produce savings only when they connect. Spend data without contract data shows what was paid but cannot show price variance, because nothing tells the team what the price should have been.
Data quality decides how far that connection goes. In Deloitte’s 2025 Global CPO Survey, CPOs most often rank data quality among their top three internal risks for implementing generative AI in procurement (43.97%). The same weakness limits every analysis a team runs on fragmented records, with or without AI.
How does spend analytics turn visibility into savings?
Spend analytics turns visibility into savings by sorting every transaction into one taxonomy, comparing spend by supplier, category, and business unit, and pointing procurement to the action that lowers cost. The chain has four steps, and each one produces what the next step needs:
- Consolidate the data. Pull invoices, purchase orders, card transactions, and contract terms from the ERP, accounts payable, card programs, and the contract repository into one dataset. The output is one record of spend, with each transaction’s supplier, amount, date, and business unit.
- Classify every transaction. Spend classification sorts each transaction into a common set of categories and supplier names, so the same purchase is counted the same way everywhere. Many teams base the taxonomy on a standard such as UNSPSC. The output is one clean name per supplier and one category per line.
- Run spend analytics. Compare spend by supplier, category, and business unit, and against contract terms. The output is a short list of findings, each with a value attached: categories split across many suppliers, purchases above contract price, and spend outside the preferred supplier list.
- Act on the findings. Consolidate suppliers, renegotiate prices with the full volume in view, or redirect off-contract buying to agreed suppliers. The output is a saving tied to specific transactions, which finance can check line by line.
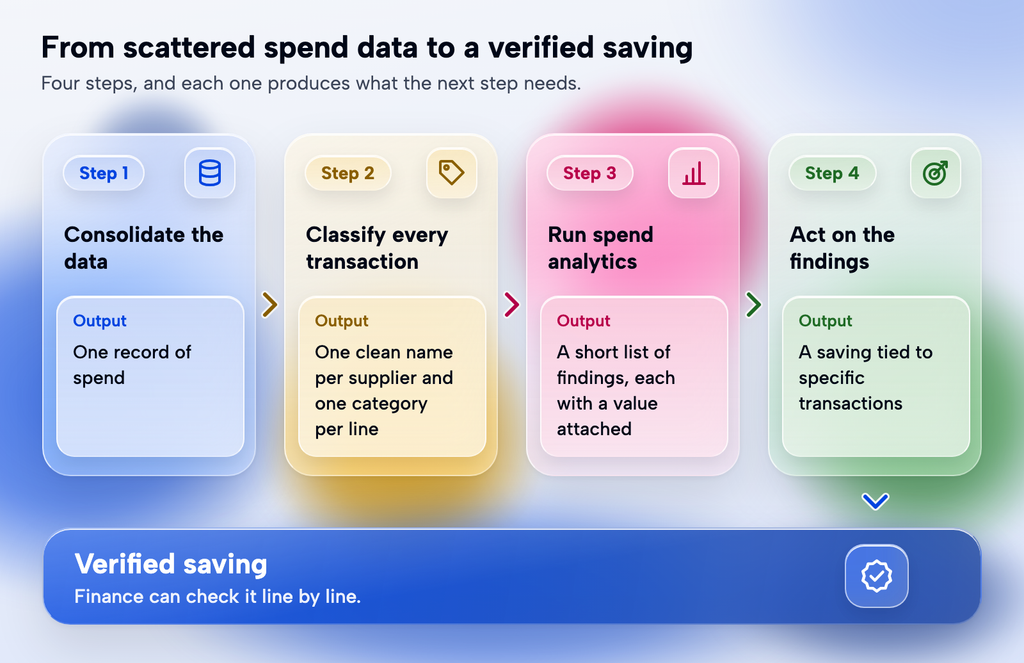
Step 2 decides whether step 3 works. When one supplier appears under three names, the analysis shows three mid-sized suppliers instead of one large one, and the consolidation case never surfaces. Organizations that centralize purchasing still meet this problem, because legacy systems and acquired entities bring their own supplier records, and decentralized purchasing multiplies it.
Supplier consolidation is usually the first saving the analysis shows. Once a category is classified, a team can see, for example, that temporary labor is bought from 12 agencies across five business units. Moving that volume to fewer suppliers gives procurement buying power in the next negotiation and cuts the contracts and invoices to manage. The team can re-source the consolidated category through an RFQ in Prokuria, with AI drafting the request and evaluating the bids.
Invoice and payment-term data adds a saving that teams often miss. Terms of 2/10 net 30 give a 2% discount for paying 20 days early, which equals about 37% a year on the cash paid early, but only when invoice dates and approval status are visible before the discount window closes. In Prokuria, payment terms and the due date sit on the invoice record, and alerts can be configured against that window.
Clean data also decides what AI tools can do. Spend analytics and dashboarding is the generative AI use case CPOs select most often in the Deloitte 2025 Global CPO Survey (53.44%), and Deloitte suggests the choice reflects poor data quality from fragmented systems. The Hackett Group reported in 2025 that top-performing procurement organizations spend 1.8 times more on procurement technology, and their analysts spend 26% more time on data analysis rather than manual data collection.
Maverick spend and off-contract buying
Maverick spend is purchasing outside agreed suppliers, contracts, or approval routes, for example a department that buys laptops on a corporate card from a retailer instead of through the contracted reseller. Each purchase looks small. Together, they pull volume away from negotiated contracts and weaken procurement’s position at the next renewal.
Once spend is visible, the analysis finds the pattern behind off-contract buying by looking for these signs:
- The same category bought from many suppliers
- Purchases priced above the contract rate
- Business units whose spend lands outside the preferred supplier list
Repeated off-contract buying usually has a reason, such as a slow catalog or a contract nobody announced, and fixing that reason is the first way to bring that spend back on contract. According to The Hackett Group’s 2025 research, Digital World Class procurement teams reduce maverick buying and contract noncompliance and lose 60% less of their savings as a result.
Contract compliance and price variance
Organizations lose an average of 11% of contract value after signature, according to World Commerce & Contracting, and the figure can be higher because most organizations do not formally track this contract value leakage, the value agreed in a contract that the organization does not collect after signing. WorldCC describes the 11% as an accumulation of losses, including missed savings, unmanaged clauses, and unauthorized changes. On $5 million of annual contract value, 11% equals $550,000 that the negotiation won and the organization never collected.
Price variance is the difference between the price paid on an invoice and the price agreed in the contract or PO. The price variance check links the contract layer to the spend layer: each invoice line is compared with the agreed rate, and every difference is either explained, for example by a new volume tier, or recovered from the supplier. Watching supplier price changes between orders also shows when a supplier’s price drifts from the agreed rate. Without connected data, the check happens by sampling, if it happens at all.
Invoice matching is the last visibility checkpoint before payment. Building it into invoice approval workflows stops price and quantity errors before money leaves, because a three-way match compares each invoice with its purchase order and goods receipt.
How do you measure procurement savings?
Procurement savings are measured at two points: negotiated savings at contract award, and realized savings in the invoices paid afterwards. Only connected spend and contract data shows both, which is why visibility decides whether finance accepts a savings figure.
A negotiated price reduction means little if invoices keep arriving at the old price. Realized savings compare what the organization paid with what it would have paid at the old terms, line by line, and that comparison needs the contract layer and the spend layer in one place. Finance can then trace each reported saving to a budget line or to invoice prices, instead of taking a negotiation summary on trust.
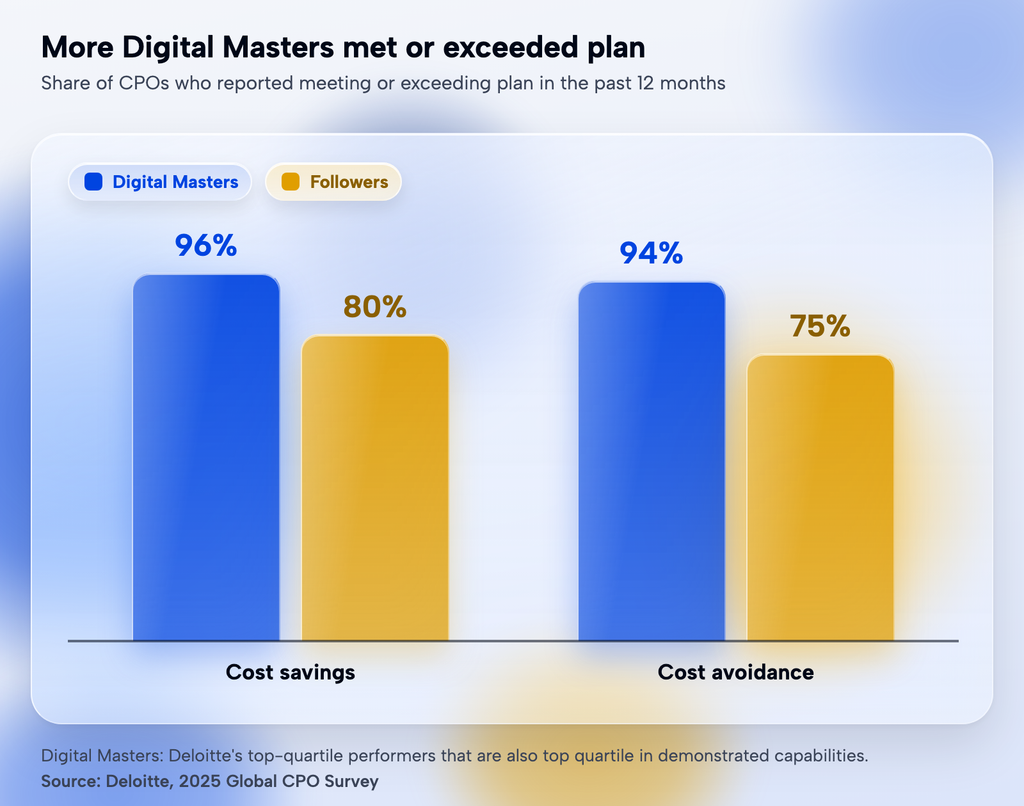
96% of Digital Masters, the top quartile performers that are also top quartile in demonstrated capabilities in the Deloitte 2025 Global CPO Survey, reported meeting or exceeding their plan for cost savings, against 80% of Followers. 94% against 75% is the same comparison for cost avoidance. The survey measures capability as a whole and does not isolate visibility. Digital Masters are also selected partly on their results. Still, a team can only report against plan when its spend and contract data connect.
Cost avoidance is a price increase or cost that was prevented, so it never shows as a lower number in the budget. Because of that, an avoided cost needs a documented baseline, such as the increase the supplier quoted, before finance will count it, so the two need their own KPIs and formulas. A third measure, spend under management, shows how much of total spend procurement can see and steer through contracts and approved channels; the overview of procurement KPIs and metrics defines it.
2.03 times greater cost savings as a percentage of spend is what The Hackett Group reported in 2025 for Digital World Class procurement organizations. Like the Deloitte comparison, the figure describes digitally mature teams as a whole, and connected data is one part of that maturity.
How to improve procurement visibility
Improving procurement visibility starts with placing your team on one of four levels and then fixing the data link that keeps it from the next one:
| Level | What the team can see | Typical sign |
| Fragmented | Spend in separate systems, with no shared supplier names or categories | Spend reports arrive weeks after month end and still disagree with finance |
| Consolidated | All spend in one dataset, with supplier names and categories not yet cleaned | Totals match, but the top supplier list shows the same supplier twice |
| Classified and connected | Clean, classified spend linked to contract terms | Price variance and off-contract buying show up in a monthly review |
| Continuous | Committed spend from requisitions and POs, updated as orders move | Buyers question a price or a supplier before the order is placed |
These first steps move a team up one level at a time:
- Connect the data sources, so the ERP, accounts payable, card programs, and the contract repository feed one dataset.
- Agree one taxonomy and clean the supplier master data, so each supplier has one record and each line one category. A supplier portal where suppliers keep their own tax IDs and addresses current, such as Prokuria’s, takes part of that cleanup off your team.
- Link spend to contracts, so every invoice line can be checked against its agreed price.
- Bring requisitions and purchase orders into one approval flow, so committed spend shows before invoices arrive.
- Assign an owner for data quality in procurement, finance, and IT.
Starting with the suppliers that account for the largest share of spend gives the analysis usable data sooner than cleaning the whole supplier base at once.
None of these steps is a quick win. The work needs procurement, finance, and IT to agree on definitions and owners, and it takes sustained effort.
Shared tooling is still rare: World Commerce & Contracting reports that only 15% of organizations run shared contracting technology between Legal and Procurement. Capacity is shrinking at the same time, since The Hackett Group’s 2026 Procurement Key Issues Study projects procurement workloads to grow 8% in 2026 while headcount and operating budgets decline.
A one-off spend analysis project is the common alternative. An analyst or a consultant cleans a year of data and finds savings, which is a valid starting point, but the snapshot ages within months as new suppliers, contracts, and business units appear. Continuous visibility keeps the classification and the contract links current, so each new purchase lands in the right category.
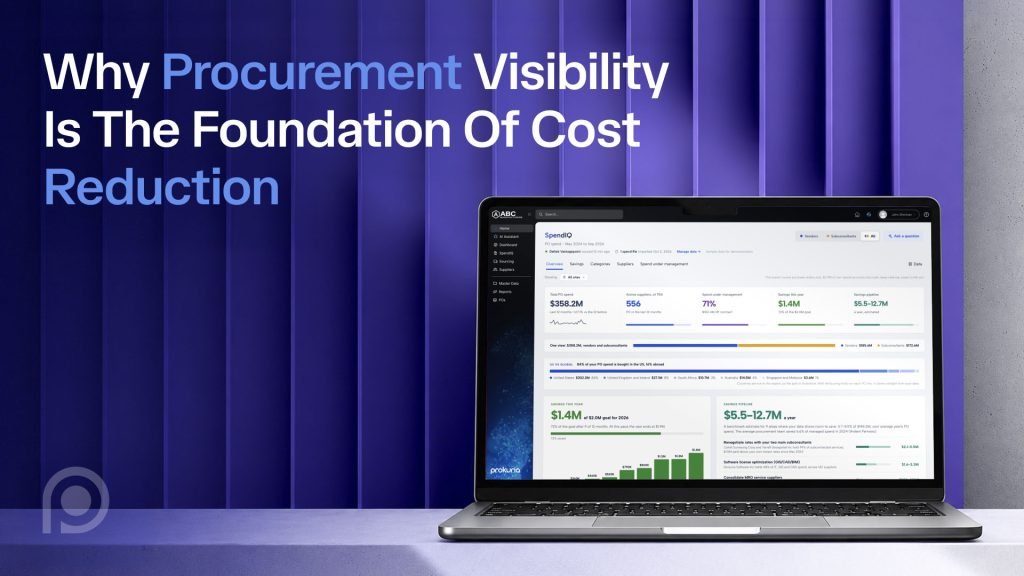
SpendIQ, Prokuria’s spend analytics module, takes the spend data a team already has, suggests a category for each line for the team to review, and flags duplicate suppliers, price inconsistencies, and off-contract buying. Requests, orders, and approvals run in Procurement Workflows, where the purchasing reports and dashboards show spending and supplier performance, including data from delivery notes. 75% of Prokuria users deliver cost savings in their first month.
Conclusion
Cost reduction depends on a chain that starts with visibility. Connected data on spend, suppliers, contracts, and process lets spend analytics classify and compare purchases, the analysis points to supplier consolidation, renegotiation, or redirected buying, and the same connected records let finance verify each saving. A team that skips the first link negotiates savings it cannot track, and the 11% of contract value that World Commerce & Contracting finds lost after signature shows what that costs.
Supplier consolidation, contract compliance, and savings reporting all draw on the same connected records, so work on visibility pays back in more than one place. The next step is to place your team on the four levels above and fix the one data link that blocks the next level.
Book a 30-minute demo and bring one supplier process with you.